Why Capacity Answers Are Usually Vague
Ask a factory how many bags it can make each month and you will usually get a number. Ask what that number assumes and the answer becomes far less certain, because capacity is a conditional figure rather than a fixed one.
What capacity actually measures
Capacity is the output a factory can sustain over a period with its current people, machines, layout and order mix. Change any of those and the number changes, which is why a single figure is always an approximation.
The useful question is therefore not “how many bags can you make?” but “how many of these bags, in this specification, at this quality level, can you make each month while serving your other customers?”
The three numbers factories quote
| Figure | What it means | How reliable |
|---|---|---|
| Theoretical capacity | Lines running flat out, no downtime | Rarely achievable in practice |
| Practical capacity | Realistic output with normal losses | The number to plan with |
| Available capacity | Practical capacity minus committed orders | What matters to you |
The theoretical figure is a marketing number; the practical figure is an operational one; the available figure is the buyer’s number. Ask for all three and check that the arithmetic connects them.
Why the answer is conditional
A factory producing simple totes can move a very different unit volume than the same factory producing heavily detailed bags with custom hardware. The machinery is similar; the minutes per piece are not.
Factory mix matters too. A supplier with loyal long-term customers reserves capacity for them first, so a large theoretical figure may translate into a small available slot for a new buyer.
The Units of Capacity
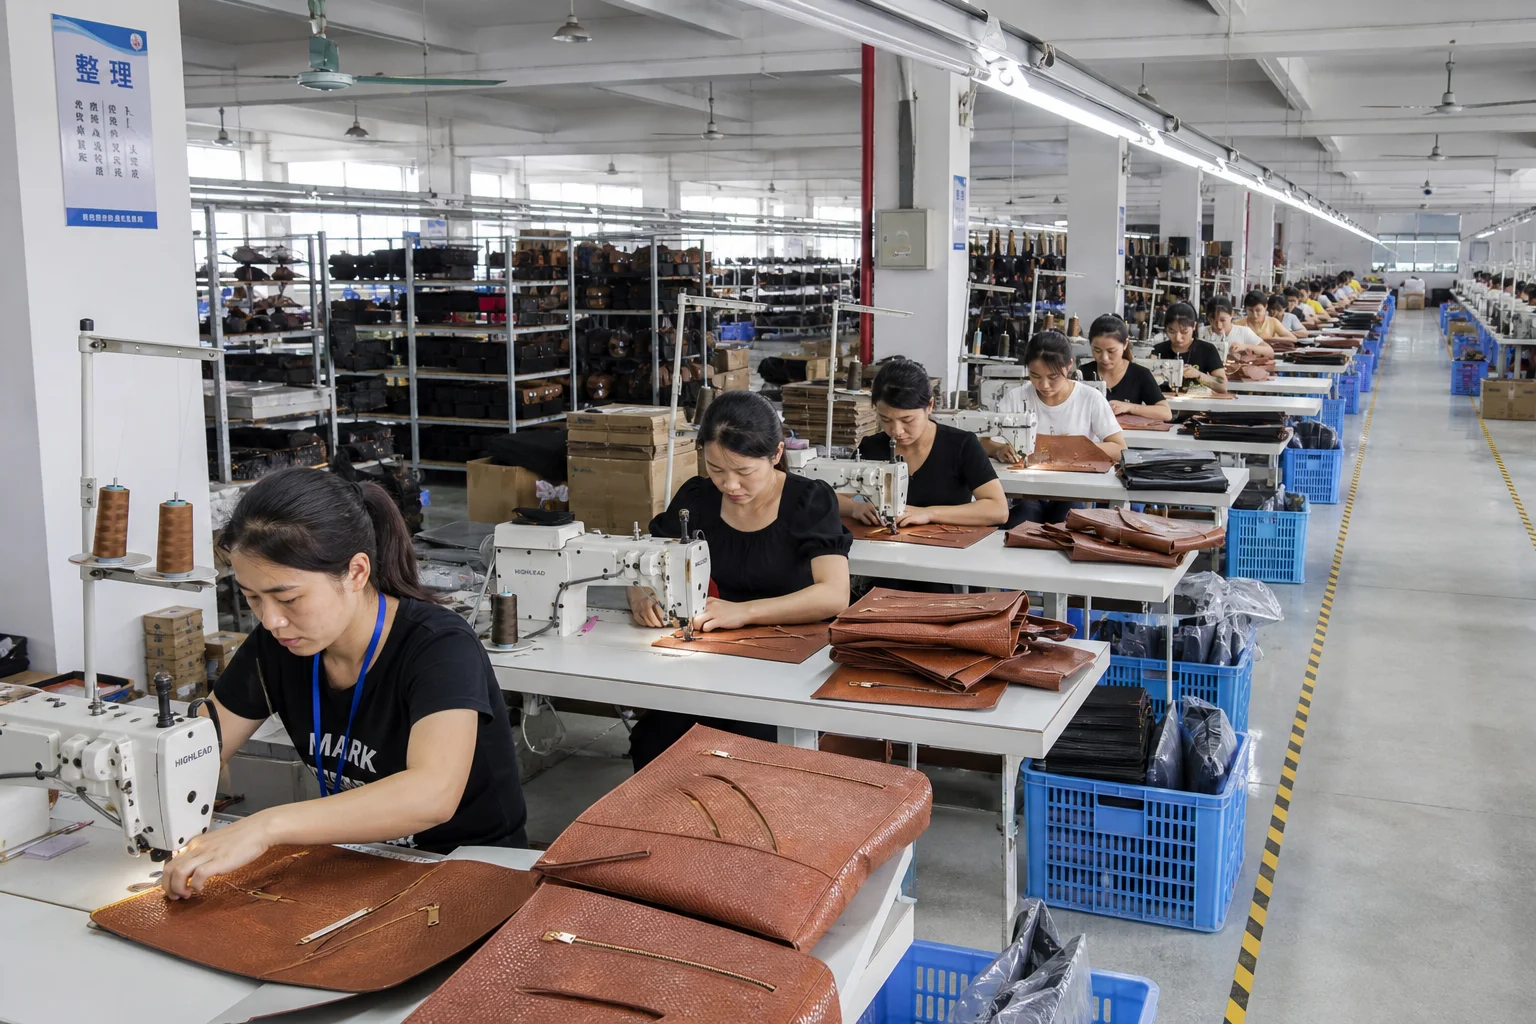
To compare a capacity claim with your order, it helps to work in the units a factory actually plans with: stations, shifts and minutes per piece.
Stations, lines and people
A line is a set of stations each performing one part of the process: cutting, skiving, stitching sub-assemblies, assembling the body, setting hardware, finishing, inspecting and packing. The line’s output is limited by its slowest station.
Because bags are assembly products, the number of operators is a better guide than the number of machines. A factory may own fifty machines but staff only thirty of them on a given shift.
Standard minutes per bag
Factories estimate how long a style takes in standard minutes, often called the standard allowed minute. It aggregates every operation from cutting to packing for one unit of that style.
A simple tote might take a small fraction of the time a structured briefcase requires, so the same line can produce very different unit volumes depending on the mix.
Example standard minutes by style
| Style | Operations | Standard minutes |
|---|---|---|
| Simple shopping tote | Light assembly | 12–18 |
| Casual shoulder bag | Moderate, lining, zip | 25–35 |
| Structured handbag | Multiple panels, hardware | 45–70 |
| Business briefcase | Complex, reinforced, detailed | 70–110 |
| Travel duffel with fittings | Heavy assembly, trims | 60–95 |
The ranges are indicative and vary with the factory’s method, the material and the quality standard. What matters is that the number is expressed as time per piece, which is comparable across suppliers.
Calculating Real Monthly Output
With standard minutes known, monthly capacity becomes arithmetic rather than assertion. The result shows immediately which assumption drives the answer.
The basic formula
Monthly output equals the number of operators, multiplied by working hours per operator per month, multiplied by the efficiency factor, divided by the standard minutes per bag.
Every term is arguable: headcount, hours, efficiency and minutes. That is precisely why the formula is useful — it turns the discussion into four checkable numbers instead of one claim.
A worked example
Take a line with forty operators working twenty-six days a month on ten-hour shifts, giving 10,400 operator-hours. At 70 percent efficiency, that is 7,280 productive hours, or 436,800 productive minutes.
For a casual shoulder bag at thirty standard minutes, that is roughly 14,500 units a month. For a structured handbag at fifty-five minutes, it falls to about 7,900 units — the same line, less than 55 percent of the volume.
Output at different efficiency levels
| Efficiency | Structured handbag (55 min) | Casual bag (30 min) |
|---|---|---|
| 55% | About 6,200 units | About 11,400 units |
| 65% | About 7,400 units | About 13,500 units |
| 70% | About 7,900 units | About 14,500 units |
| 80% | About 9,100 units | About 16,600 units |
The table also shows why a factory quoting a single monthly figure is not being evasive: the number genuinely depends on which style you ask about and how efficiently the line runs.
Adding your order to the picture
Once you have the practical monthly output, deduct the capacity already committed to other customers. What remains is the available capacity that a new order can realistically claim.
Ask when the slot would open, not merely whether capacity exists. A factory at full utilisation for three months can still be the right partner if your delivery date fits after that point.
Efficiency: The Hidden Variable
Efficiency is the term that moves capacity claims the most and is the least visible in a quotation. It is worth understanding what it measures and what changes it.
What efficiency means in practice
Efficiency is the share of paid minutes that actually produce sellable output. The rest goes to setup, material handling, rework, machine stops, quality checks and waiting between operations.
A line at 70 percent is performing normally in bag manufacturing; a line claiming 95 percent is either measuring differently or describing a theoretical ceiling.
What changes efficiency
| Factor | Effect on efficiency |
|---|---|
| Style complexity | New styles start slower, then improve |
| Order size | Long runs amortise setup better |
| Material consistency | Variance causes stops and rework |
| Operator skill | Directly sets pace and defect rate |
| Line balance | Uneven stations create idle time |
| Quality standard | Stricter inspection reduces net output |
Two factories with the same headcount and hours will report different capacity if their styles, standards and skill levels differ. That is normal, and it is why comparing capacity without context is unreliable.
The learning curve on a new style
A new style never starts at full speed. Output typically climbs over the first batches as operators learn the sequence and the line rebalances, which means the first week of a run produces less than the average.
Ask how long the ramp-up takes for your style. That answer is more useful for scheduling than the steady-state monthly figure alone.
Seasonality and the Production Calendar
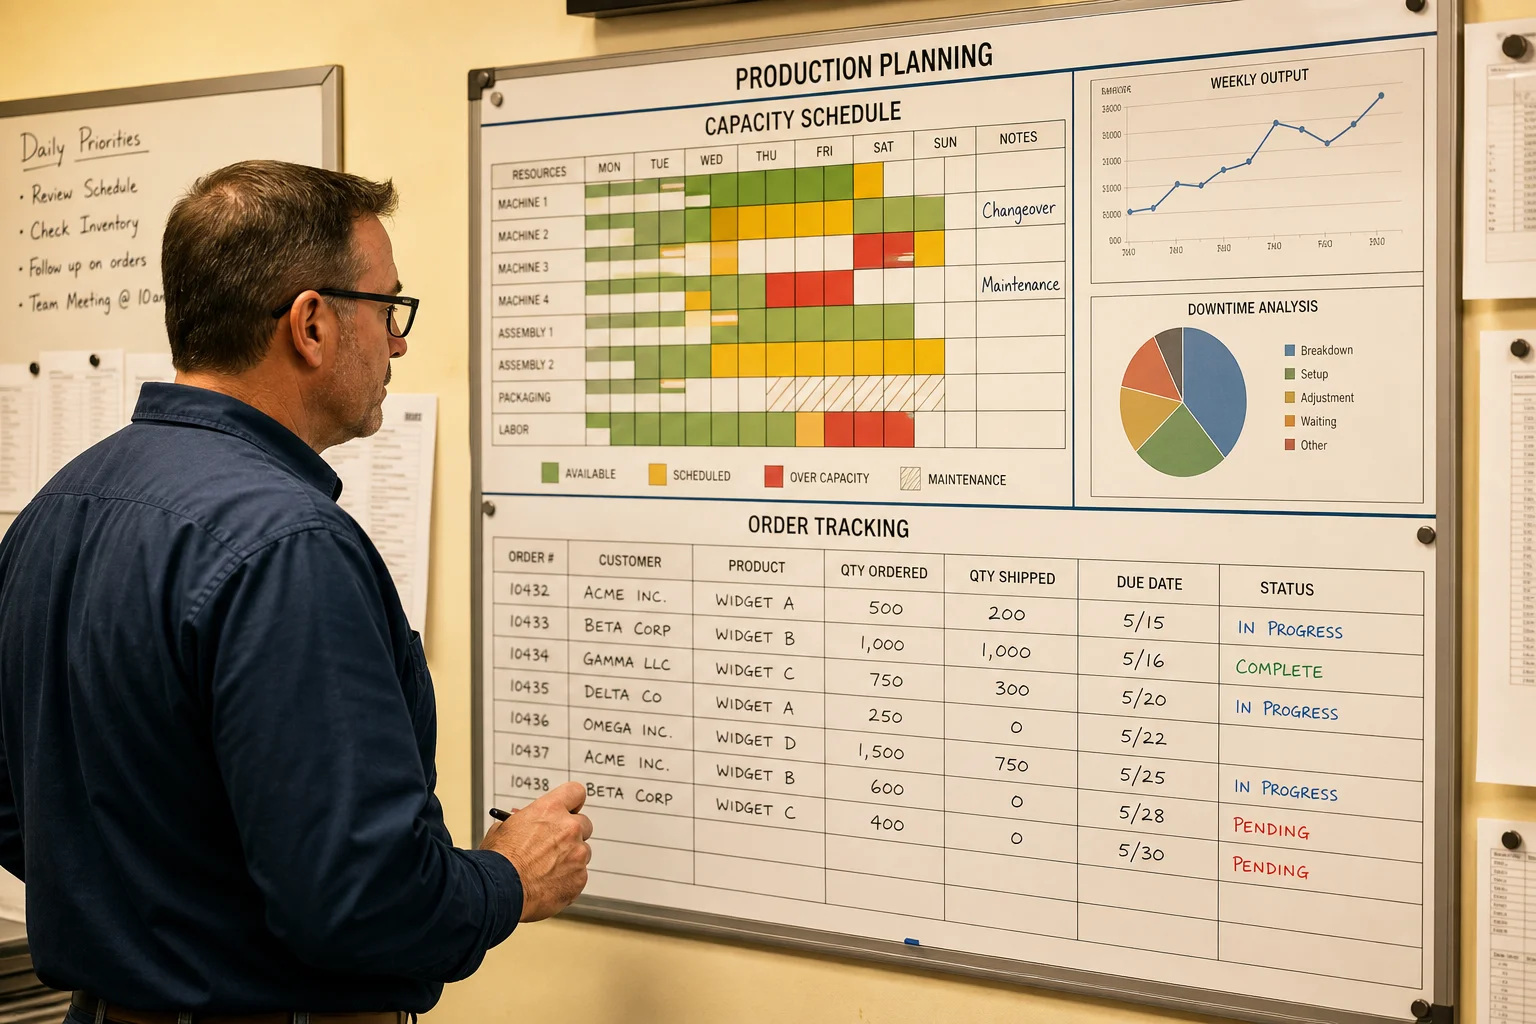
Capacity is not evenly distributed through the year. Demand peaks, holidays and material availability all create periods when the same factory can make much less than its average.
The annual demand cycle
Bag manufacturing follows retail calendars: orders for spring and summer collections cluster in one period, autumn and winter in another, and promotional programmes add their own peaks.
Those peaks coincide across buyers, which is when capacity is scarcest and lead times longest. Booking a slot early is often more valuable than negotiating a lower unit price.
Holidays and their real effect
| Period | Impact on output | Planning implication |
|---|---|---|
| Lunar New Year | Two or more weeks lost, plus ramp-up | Plan production well before or after |
| National holidays | One week or more | Build into the delivery date |
| Peak season | Capacity fully booked | Reserve slots in advance |
| Post-holiday ramp | Lower output on restart | Allow extra days early in the month |
The Lunar New Year effect is the largest and the most often underestimated: the lost weeks are visible, while the slow restart afterwards is not, so delivery dates slip.
Booking capacity in advance
Factories allocate line time to customers with confirmed orders and clear schedules. A buyer who provides a rolling forecast, even an approximate one, competes better for capacity than one who appears with an urgent request.
A forecast costs nothing and often secures a better slot. Indicating your annual volume and rough monthly split gives the planner something to work with.
Bottlenecks and Sub-Contracting
A factory’s true capacity is set by its slowest stage, not its average. Identifying that stage is how you find out whether the number you were quoted is achievable.
Where bag production bottlenecks
| Stage | Typical bottleneck cause |
|---|---|
| Cutting | Press capacity or pattern efficiency |
| Skiving and preparation | Few machines, skilled work |
| Body stitching | Complex panels, few senior operators |
| Hardware setting | Manual, tooling-dependent |
| Quality inspection | Strict standards slow the flow |
| Packing | Packaging availability, labour |
The most common bottleneck in bag manufacturing is senior stitching capacity, because the difficult operations concentrate in a few experienced hands.
Sub-contracting and what it means for you
Factories often use partner workshops for overflow or for specialised operations such as welding or embossing. This is normal and not automatically a quality problem.
What matters is whether the work is controlled: the same specification, the same inspection standard and traceability back to the shipment. Ask which operations are sub-contracted and how they are inspected.
Questions that reveal the real constraint
Ask which stage delays an order when volumes rise, what the factory does when a line is fully booked, and which operations it outsources. The answers describe the actual production system rather than the brochure.
A supplier who answers these questions precisely is showing you a managed factory. A supplier who answers vaguely is either unaware of its own constraint or unwilling to discuss it.
Capacity and Lead Time
Lead time is capacity seen from the buyer’s side. It is the sum of several stages, and only one of them is the actual production run.
The components of lead time
| Stage | Typical duration | What shortens it |
|---|---|---|
| Sampling and approval | 1–3 weeks | Complete specification upfront |
| Material sourcing | 1–3 weeks | Standard materials, early confirmation |
| Custom component production | 3–6 weeks | Standard hardware, early tooling release |
| Production run | 2–5 weeks | Larger line allocation, simpler design |
| Inspection and packing | 2–5 days | Clear inspection plan |
| Shipping | Depends on mode | Earlier booking |
Custom hardware and custom materials usually dominate the total. A bag with a standard zipper and no custom trim can be produced markedly faster than one waiting on a new mold.
Rush orders and what they cost
A rush order is accommodated by displacing another order, adding overtime or splitting the run. All three carry a cost, which is why a genuine rush usually attracts a premium.
Be sceptical of a factory that accepts every rush request without adjusting anything. Either the original schedule was padded or the rush will be absorbed by someone else’s delay.
Planning with capacity in mind
Work backwards from the delivery date through shipping, inspection, production, material sourcing and sampling, and add a contingency for holidays. That backwards plan shows where the schedule is tight.
Sharing the plan with the factory early turns the schedule into a joint commitment rather than an expectation, and gives the planner time to reserve the line slot you need.
Verifying a Capacity Claim
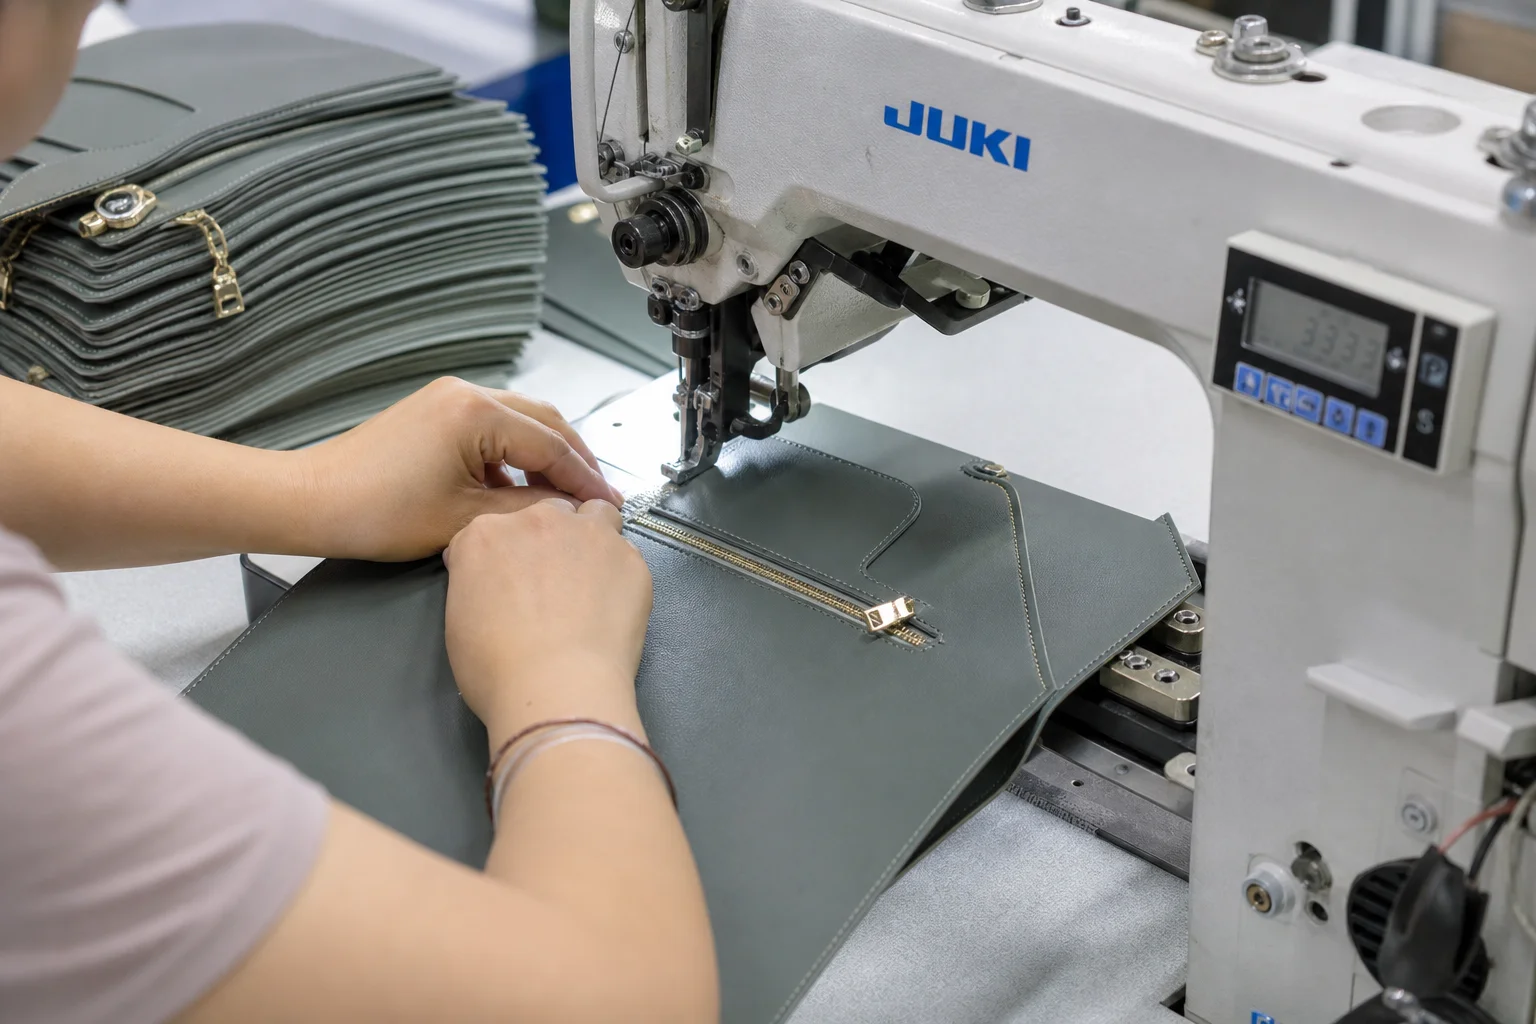
Capacity claims can be checked without auditing the accounts. A short list of observable facts distinguishes a factory that can deliver what it says from one that is repeating a number.
What to observe on a factory visit
Count the operators actually working, note how many machines are idle, and look at how much work in progress is sitting between stations. A crowded floor with full buffers is running at or near capacity.
Note which stations are busy and which are waiting. That single observation usually reveals the bottleneck without a single question being asked.
Documents worth asking for
| Evidence | What it shows |
|---|---|
| Production schedule | Current committed load and free slots |
| Line layout and headcount | Real operator count per stage |
| Output records by style | Actual daily and monthly volumes |
| Inspection records | Quality level behind the output |
| Sub-contractor list | Which operations leave the site |
| Certification and audit reports | Compliance and process control |
Factories accustomed to professional buyers have these documents ready. Being asked for them is normal, and reluctance is itself informative.
Cross-checking the numbers
Compare the claimed monthly output with headcount, hours and style complexity using the formula earlier in this guide. A claim that requires implausible efficiency deserves a follow-up question.
Ask for output figures for a specific recent month on a specific style. Concrete history is much harder to overstate than a general capacity claim.
Testing with a first order
The most reliable verification is a real order at a modest size, measured against the promised schedule. Track the actual ship date, the output per day and the defect rate, then decide the larger commitment.
This approach also establishes your credibility as a buyer. A supplier who sees a well-organised first order tends to allocate better capacity to the second one.
Scaling as Your Orders Grow
Capacity becomes a strategic question once your volumes grow. At some point the constraint moves from the factory’s floor to your own planning.
How factories absorb growth
| Method | Speed | Effect on quality and price |
|---|---|---|
| Overtime on existing lines | Days | Higher cost, fatigue risk |
| Add a shift | Weeks | Needs supervision and training |
| Open a new line | One to two months | Requires hiring and ramp-up |
| Sub-contract part of the run | Immediate | Consistency risk without control |
| Second factory in parallel | Months | Duplicated setup and standards |
Each option trades speed against consistency. Sub-contracting is the fastest and the most likely to introduce quality variance, while opening a new line takes longer but keeps the standard under one roof.
Planning your growth with the factory
Share your forecast a season ahead so the factory can reserve capacity rather than react to it. A planned increase is absorbed by scheduling; an unplanned one is absorbed by overtime.
Where growth is significant, discuss a dedicated line. A line assigned to your programme keeps your standards consistent and removes competition for the same skilled operators.
When to add a second supplier
Consider a second factory when your volume exceeds one supplier’s comfortable capacity, when you need a fallback for business continuity, or when you want a cost benchmark.
Splitting a programme across two factories requires the same specification, the same approved sample and consistent inspection. Without that discipline the price benefit is offset by variance.
Keeping capacity honest over time
Review the relationship annually against delivery performance, defect rates and responsiveness rather than price alone. A supplier that grows with you reliably is worth more than a marginally cheaper alternative.
Capacity is a relationship asset. Factories allocate their best slots to buyers who plan, communicate and pay on time, whatever the size of the order.
Capacity is never a single number. It is what remains after the ordinary losses of a real factory are deducted — and it belongs to whoever planned for it first.
Capacity Planning for Your Own Programme
Once you can read a factory’s capacity, the next step is planning your own programme against it. The buyer’s planning decisions determine whether the available capacity is actually usable.
Building a rolling forecast
A rolling forecast states your expected volumes by month for the next two to four quarters, with the near months specific and the later ones indicative. It does not commit you to buying, but it lets the factory reserve line time.
Update it monthly and flag significant changes as soon as they are known. A forecast that is revised early is a planning input; one revised after the materials are ordered is a disruption.
Smoothing demand across the year
| Approach | Effect on capacity access |
|---|---|
| Spread orders across quarters | Better slots, steadier pricing |
| Place one large seasonal peak | Competes with every other buyer |
| Order early for peak season | Secures slot before the rush |
| Combine styles into one run | Fewer changeovers, better efficiency |
| Standardise materials across styles | Fewer sourcing delays |
Smoothing does not mean ordering less; it means placing the same annual volume in a pattern the factory can plan. The reward is usually a better delivery record at the same price.
Choosing order sizes deliberately
Small, frequent orders keep inventory low but consume line slots with frequent changeovers. Large, infrequent orders improve efficiency but tie up capital and warehouse space.
Find the balance by calculating the total cost of ownership: unit price, freight, storage, working capital and the risk of unsold stock. The cheapest unit price rarely produces the lowest total cost.
Coordinating multiple styles
Where a range includes several styles, sequence them so that similar materials and constructions run together. This reduces changeover time and lets the factory hold efficiency across the whole range.
Grouping also simplifies your own inspection: one visit can cover several styles if they are produced in a planned sequence rather than scattered across the calendar.
Contingency and business continuity
No supplier is immune to disruption: a fire, a flood, a labour shortage or a sudden material scarcity can interrupt production. Planning for that possibility is part of capacity planning, not a separate exercise.
Keep your specification, approved sample and material references current and portable, so that a second factory could pick up the programme with limited development time. That documentation is your continuity insurance, and it costs nothing to maintain.
It is also worth knowing which materials have single-source dependencies. A custom-dyed PU leather or a proprietary buckle can take weeks to replace, while a standard zipper can be sourced in days. Knowing the difference tells you where to hold buffer stock.
Quality at Volume: What Changes as Output Rises
Capacity and quality are connected. The same factory can produce excellent samples at low volume and inconsistent production at high volume if the process is not controlled as output rises.
Why defects appear at higher volumes
At low volume, experienced operators can work slowly and check their own output. At high volume, more operators join the line, work is split more finely, and the pace increases — all of which expose weaknesses in the process.
The sample approved by the buyer was made by the best hands in the factory. Production is made by the whole line, which is why the approved standard must be documented rather than remembered.
Controls that hold quality at volume
| Control | What it prevents |
|---|---|
| Documented specification | Interpretation drift between operators |
| Sealed approved sample | Gradual standard creep |
| In-line checks per station | Defects travelling down the line |
| Measurement against tolerances | Dimensional drift across the run |
| Pre-shipment inspection | Non-conforming batches shipping |
| Defect tracking by station | Recurring faults with no corrective action |
The pattern is that quality at volume is designed into the process rather than inspected at the end. Inspection catches what the process allowed through.
The cost of pushing beyond capacity
When a factory accepts more volume than it can comfortably run, the first thing to suffer is the work rate, then the rework, then the delivery date. The buyer experiences it as a late shipment with more defects.
This is the practical reason to check available capacity rather than theoretical capacity. An ambitious promise from an overloaded factory is a risk transferred to your delivery schedule.
Agreeing the quality standard in numbers
Define the acceptable quality level before production, covering defect categories and the inspection method. Numbers turn a subjective argument at delivery into a measurable acceptance decision.
Also agree what happens to a rejected batch: rework, replacement or credit. Resolving that in advance is far cheaper than negotiating it when a shipment is already at the port.
FAQ
How many bags can a factory make in a month?
It depends on the style rather than the factory alone. A line of forty operators working twenty-six ten-hour days at 70 percent efficiency can produce roughly 14,500 casual shoulder bags or about 7,900 structured handbags a month.
What is a realistic efficiency rate for bag production?
Around 65 to 75 percent is normal for a well-run bag line when efficiency is measured as productive minutes over paid minutes. Claims above 90 percent usually indicate a different measurement basis.
Should I trust a factory that claims very high output?
Check it against headcount, hours and style minutes. A high claim that requires implausible efficiency, or that omits the style assumptions behind it, is a marketing figure rather than a planning one.
What is the biggest factor limiting a bag factory’s output?
Usually the skilled stitching capacity for complex operations. Cutting and packing can be expanded more easily than the experienced hands needed for difficult assembly work.
How much does Chinese New Year affect capacity?
Two or more weeks of lost production plus a slower restart afterwards. Both effects must be built into schedules, and orders are best completed before the holiday or planned to start after the ramp-up.
Is sub-contracting a quality risk?
Only when it is uncontrolled. Sub-contracted operations are acceptable if they follow the same specification, are inspected to the same standard and remain traceable in the shipment records.
How do I check a factory’s capacity before ordering?
Ask for the production schedule, line layout, headcount and output records by style, then compare them with your own calculation. A small trial order measured against the promised schedule is the final test.
Why does lead time vary so much between suppliers?
Mainly because of material sourcing and custom component production, which dominate the calendar. Suppliers quoting unusually short lead times may be assuming standard materials or already-booked capacity.
When should I use two factories instead of one?
When your volume exceeds one supplier’s comfortable capacity, when you need business continuity cover, or when you want an independent cost benchmark. Keep specifications and inspection identical across both.
How can I get better capacity allocation from a factory?
Provide a rolling forecast, confirm orders early, keep specifications stable and pay on schedule. Planners reserve their best slots for buyers whose schedules they can rely on.
Why do defects increase when a factory runs at full capacity?
Because pace increases, more operators join the line and self-checks shorten. The approved sample was made by the best hands in the factory, so the standard must be documented and inspected rather than assumed.
Next Steps: Ask for Capacity in Units You Can Check
Capacity is a conditional figure built from headcount, hours, efficiency and minutes per piece. Ask for it in those terms, add the seasonal calendar and the bottleneck, and the answer becomes something you can plan a delivery date around.
A factory that can explain its capacity in numbers and show the records behind them is telling you how it will handle your order. That is the standard our factory works to — send us your style and volume and we will show you the real slot.
Planning a production programme? Contact our team at info@gionar.com for a capacity and lead-time assessment for your bag styles.
Related reading: our custom bag manufacturing portfolio shows the styles and volumes our lines run, from simple totes to structured handbags.