How Should Bag Returns Data Feed Back Into Factory Quality Work?
A returns report that records “changed mind” against forty percent of units tells a factory nothing. The same report, coded into seam failure, edge paint cracking, hardware tarnish, zipper drag and dimension drift, tells a quality manager which process to open on Monday morning.
That gap between a return reason and a quality action is where most bag programmes lose money. Returns are the only quality signal that arrives after the customer has used the product, and they are therefore the only evidence of failures that final inspection cannot see. Yet in most supply chains they are tracked by the sales team, reported monthly in financial terms, and never converted into the language a factory can act on.
The asymmetry between inspection and reality
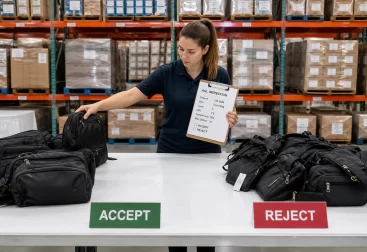
Final inspection samples a few hundred units in a controlled environment and checks what can be seen in thirty seconds under good light. Returns accumulate over months of real use: carried on a shoulder, loaded with weight, exposed to rain, wiped with solvent-based cleaners. A bag that passes an AQL inspection can still fail in month three, and only returns record that failure.
Why bags produce specific return patterns
PU leather bags concentrate failure in a small number of places. Stitching and seam strength, edge paint adhesion, hardware plating, zipper function, lining attachment, handle anchoring and colour consistency account for the overwhelming majority of claims. That concentration is an advantage: a defect taxonomy with a dozen codes covers almost everything a factory needs to fix.
What this article covers
How to code returns so they become countable, how to link a returned unit back to its production lot, which metrics actually change factory behaviour, how to move from a defect code to a process cause, how to structure corrective action with a supplier, how to adjust inspection while a fix is pending, and how to prove the fix worked on the next production run.
- Why Returns Are the Only Post-Market Signal
- Building a Defect Taxonomy for Bags
- Capturing Return Data at the Counter
- Linking Returns to Production Lots
- Metrics That Drive Factory Behaviour
- Reading the Pareto Before Acting
- From Return Reason to Process Cause
- Structuring Corrective Action With the Factory
- Containment While the Fix Is Pending
- Adjusting AQL and Incoming Checks
- The Review Cadence That Works
- Scorecards and Commercial Consequences
- Verifying the Fix on the Next Lot
- Retaining Returned Units as Evidence
- Failure Modes That Break the Loop
- Sharing Returns Data Without Losing Leverage
- Running the Loop With a Small Range
- The First Ninety Days
- Trending the Codes Over Time
- FAQ

Why Returns Are the Only Post-Market Signal
What inspection cannot see
Inspection measures conformance to a specification at a point in time. It cannot measure how a stitched handle behaves after two hundred loading cycles, or whether an edge paint film survives a humid summer. Those failures appear only in use, and the first structured record of them is the return.
Why sales data is the wrong owner
When returns are owned by the sales function, they are reported as a financial ratio and closed with a credit note. Nothing reaches the factory, and the same defect is produced in the next order with identical tooling and identical operator technique.
The cost that stays hidden
A returned bag costs the unit cost, the outbound freight, the return freight, the inspection time, the replacement and the lost customer. In most programmes the visible credit note is a fraction of that figure, which is why returns are consistently under-managed relative to their real cost.
Building a Defect Taxonomy for Bags
Twelve codes that cover most claims
A workable taxonomy for PU leather bags uses roughly a dozen codes: seam failure, stitch appearance, edge paint, hardware function, hardware finish, zipper function, lining defect, handle attachment, dimension or capacity error, colour deviation, odour, and packaging damage. Each code maps to a process area.
One code per unit, not per complaint
A customer may describe three symptoms. The inspector assigns one primary code based on what actually failed, and records secondary observations separately. Mixing them destroys the counts that make the analysis possible.
Keeping the taxonomy stable
Codes should not be renamed mid-year. If a new failure type appears, it is added as a new code with a note, so historical comparisons remain valid and a Pareto built in March still means something in October.
| Code | Typical finding | Process area |
|---|---|---|
| SEAM | Opened or skipped stitches | Stitching, needle and tension |
| STITCH | Uneven or wandering topstitch | Operator technique, guide |
| EDGE | Edge paint cracking or peeling | Edge finishing, curing |
| HWFUNC | Clasp or magnetic snap fails | Component sourcing |
| HWFIN | Plating tarnish or wear | Plating specification |
| ZIP | Slider drag or tooth misalignment | Zipper grade, tape tension |
| LINING | Lining tear or detachment | Lining material, seam allowance |
| HANDLE | Anchor pull-out | Reinforcement, bar tacking |
| DIM | Size outside specification | Pattern, cutting, shrinkage |
| COLOR | Shade differs from standard | Material batch, lighting |
| ODOR | Residual solvent smell | Adhesive, drying time |
| PACK | Crushed or scuffed in transit | Packing, carton strength |
Capturing Return Data at the Counter
The quality of every downstream analysis is set at the moment the return is accepted. Six fields captured at that moment are worth more than a page of free text written a week later.
The minimum data set
Style code, production lot or shipment reference, defect code, date of purchase, date of return and a photograph of the fault. Six fields, all of which the person at the counter can capture in under a minute with a phone camera and a drop-down list.
Photographs that are actually usable
One wide shot of the whole bag and one close-up of the fault, taken in daylight rather than under warm shop lighting which hides shade differences. A photograph taken under the wrong light can turn a colour complaint into a stitching complaint.
What the customer says versus what failed
Customer wording is recorded verbatim but never used as the classification. “It broke” usually means a handle anchor, a clasp or a zip pull, and only the inspection distinguishes them. Both are stored; only one drives the count.
Why free-text fields fail
A free-text box is filled in differently by every person who uses it, which makes counting impossible without a manual coding step that nobody performs. A drop-down list of twelve codes takes ten seconds and produces data that can be grouped the same day.
Linking Returns to Production Lots
Without a lot link, a defect rate is an average across a year of production and cannot be traced to a machine, an operator shift or a material batch. The link is what converts a number into a target.
The traceability chain
Style code plus shipment reference plus carton number identifies a lot. The factory keeps the production record behind that lot: date of cutting, material batch, line and shift, inspector and the AQL result. A return that carries a carton number can be traced back through all of it.
What to require on the product
A small lot code on the internal label or the inside of the pocket is enough for the retail channel. For wholesale buyers, the carton label and the packing list already carry the reference, which keeps the product itself unmarked.
When the link is missing
If fewer than half of the returns can be attributed to a lot, the analysis degrades into broad statements about the supplier. In that case the first improvement project is not a quality fix but a labelling fix.
Metrics That Drive Factory Behaviour
Return rate alone is not actionable
A return rate of four percent says nothing about what to change. A seam failure rate of 1.8 percent against a target of 0.5 percent names the process, the target and the gap, and a factory can respond to it.
Defect-specific rates and cost of poor quality
Each code carries its own rate per thousand units sold. Multiplying those units by the full cost of a return — unit cost, two freights, handling and replacement — produces a cost of poor quality that speaks to a factory owner far more clearly than a percentage.
Claims under warranty and repeat failures
Two further metrics matter: the share of returns that are second claims on the same style, and the time from purchase to failure. A cluster of failures at three to five months points to a durability issue that inspection will never catch.
Setting the first target
The first target should come from the data rather than from an ambition. Take the best-performing three lots of a style and use their combined rate as the initial benchmark, then ask the factory to bring the median lot to that level within two seasons.
| Metric | Formula | What it drives |
|---|---|---|
| Return rate | Returns divided by units sold | Overall health |
| Defect rate by code | Units per code divided by thousands sold | Process targeting |
| Cost of poor quality | Returns multiplied by full cost per return | Investment priority |
| Repeat claim share | Second claims divided by total claims | Fix effectiveness |
| Time to failure | Median months from sale to return | Durability testing |
| Lot attribution rate | Returns with lot divided by all returns | Traceability health |
Reading the Pareto Before Acting
Three codes usually carry most of the loss
In most bag programmes, three defect codes account for the majority of claims and the majority of cost. Fixing those three is a different programme from fixing twelve, and the difference in resource is large.
Rank by cost, not by count
A high-count packaging scuff costs a replacement bag. A low-count handle pull-out costs a replacement, a return, a complaint and sometimes a wholesale account. Ranking by cost rather than frequency regularly changes which defect is worked first.
Watch the tail for emerging issues
The tail is small but not meaningless. A new code appearing at two percent and doubling month on month is the next main issue, and it is visible only if the taxonomy is reviewed rather than scanned.
A Pareto chart is not a report. It is an instruction about where to spend the next month of engineering attention.
From Return Reason to Process Cause
Asking why five times with the factory
A cracked edge paint is not a cause. Asking why produces the sequence: the film was applied too thin, because the operator was trained on a different edge width, because the specification changed without a work instruction update. The fifth why is where the fix lives.
Separating machine, material, method and operator
A simple cause framework keeps the discussion honest. Handle pull-out is usually method and reinforcement; tarnish is material and plating specification; uneven topstitch is machine tension and operator technique. Naming the category prevents the default answer of “operator error”.

Using the returned unit as the primary evidence
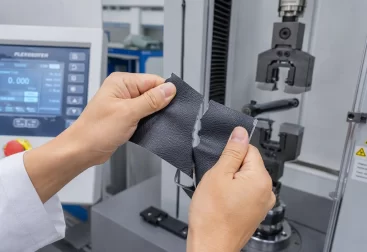
The returned bag itself is the strongest evidence available: the stitch density can be counted, the edge film thickness measured, the plating examined. A cause analysis conducted on a photograph alone is a guess; conducted on the unit, it is an inspection.
Structuring Corrective Action With the Factory
A corrective action request sent as a complaint gets an apology. The same request sent as four defined steps gets a change in the process, and the difference is entirely in the structure.
Containment, cause, correction, prevention
The four-part structure is standard because it works. Contain the units already in the pipeline, identify the cause with evidence, correct the process, and put a preventive control in place that would catch the same failure before it ships. Each part needs an owner and a date.
Writing a request the factory can answer
The request should state the defect code, the affected lots, the failure rate, photographs, the returned unit reference, and the specific question being asked. Vague requests produce vague replies, and a vague reply cannot be verified on the next lot.
Accepting evidence rather than assurances
“We have instructed the operators” is not a corrective action. A revised work instruction, a changed needle size, a new tension setting recorded on the machine card, or a plating specification from the hardware supplier is. The test is whether the change can be inspected.
Containment While the Fix Is Pending
What containment actually means
Containment protects the customer while the process change is being implemented. It covers stock in the warehouse, stock in transit and stock at the factory, and it usually takes the form of a hundred percent check on the specific defect rather than a general inspection.
Costing containment honestly
A hundred percent check on one characteristic costs time but not much money. Shipping unverified stock usually costs more, because the failure rate that produced the return has not changed and the next batch will fail in the same proportion.
Setting an exit condition
Containment ends when three consecutive lots pass the targeted check at the agreed rate. Without a written exit condition, containment becomes permanent, expensive and eventually ignored.
Adjusting AQL and Incoming Checks
Tightening the right characteristic
AQL levels are usually set by defect class rather than by known failure mode. Where returns show a specific code dominating, that characteristic deserves a dedicated check with its own sampling plan, independent of the general cosmetic inspection.
Adding tests that predict the return
Handle load testing, zipper cycle testing and edge flex testing reproduce in minutes what a customer discovers in months. Where a return code maps to a durability failure, a laboratory test is the only way to catch it before shipment.
Removing checks that add nothing
Every inspection point costs money. Where a check has produced no findings across several lots and no return code maps to it, it can be reduced. Inspection capacity is better spent on the three codes that carry the loss.
The Review Cadence That Works
Weekly operational review
A short weekly look at the previous week’s returns, coded and attributed, catches emerging clusters while the lots are still identifiable and the material batch is still in stock. Monthly is too slow for a defect that appears in a specific shipment.
Monthly quality meeting with the factory
Once a month the data goes to the factory with the top three codes, the affected lots and the status of open corrective actions. The meeting is short, the agenda is fixed, and the output is owners and dates rather than discussion.
Quarterly commercial review
Quarterly, the same data becomes a commercial conversation: trends, open actions, chargeback totals and the quality section of the next negotiation. Keeping the operational and commercial conversations separate prevents the weekly meeting from becoming a pricing argument.

Scorecards and Commercial Consequences
Four numbers on a single page
A supplier scorecard that works carries four numbers: total return rate, the top defect code rate, the percentage of corrective actions closed on time, and the lot attribution rate. Everything else belongs in the appendix, where it will be read by nobody.
Making the scorecard mean something
A scorecard with no consequence is a newsletter. The consequence does not have to be a penalty: it can be the share of the next season’s volume, the right to quote on a new programme, or the removal of incoming inspection for a supplier that sustains a low rate — which is a genuine commercial benefit because it removes cost from the buyer’s side.
Chargebacks used as a diagnostic
Chargebacks recover cost but their greater value is attention. A chargeback that itemises the defect code, the lot and the calculation is a document the factory owner reads; a lump-sum deduction is an accounting entry that gets absorbed into the price of the next order.
| Scorecard field | Target direction | Review |
|---|---|---|
| Total return rate | Down | Monthly |
| Top defect code rate | Down | Weekly |
| Actions closed on time | Up | Monthly |
| Lot attribution rate | Up | Quarterly |
| Repeat claim share | Down | Quarterly |
| Containment exit achieved | Yes | Per lot |
Verifying the Fix on the Next Lot
Define the test before the fix
Before the corrective action is accepted, agree how success will be measured: which check, on which characteristic, at what sample size, across how many lots. Without this, the factory reports success and the next return code tells a different story.
Compare like with like
The verification compares the same style, the same material batch where possible, and a comparable sales window. A fix introduced in a low season and judged in a high season will look better than it is, because return rates lag sales by two to three months.
Closing the action in the record
When the verification passes, the action is closed in writing with the evidence attached, and the result is recorded against the defect code. That record is what prevents the same discussion from being reopened in a year with a new quality manager on the buyer’s side.
What counts as evidence
Inspection records for the targeted characteristic, the machine setting or work instruction change, and three consecutive lots at or below the agreed rate. A statement that the problem has been solved counts as a claim, not as evidence, and it is the difference between a closed action and a deferred one.
Retaining Returned Units as Evidence
Keep a sample, not the stock
Retaining every returned bag is impractical. Retaining two or three units per open defect code, labelled with lot, date and code, is enough to support a cause analysis, a supplier discussion or a claim, and it takes one shelf.
Documenting the unit
Each retained unit carries a short record: defect code, lot, date of return, measurements taken, and the conclusion. The record is what makes the unit evidence rather than clutter, and it is what a new team member reads before the next review.
Disposing at the right time
Units are kept while the action is open and for one review cycle after closure, then disposed of. Keeping everything forever produces a room nobody enters, which is the same as keeping nothing.
Failure Modes That Break the Loop
Data that arrives too late
A quarterly return report arrives after the material batch is consumed and the operators have rotated. Even a correct analysis then produces a fix that cannot be traced to a lot, so its effect cannot be verified.
Aggregation that hides the target
A single return rate across all styles averages a good style with a failing one and produces a number that cannot be acted on. Segmentation by style and code is what turns a metric into a task.
Blame instead of process
When the data is used to penalise an operator or a line supervisor, the data stops being recorded accurately. The loop depends on honest coding, and honest coding depends on the data being used to fix processes rather than to assign fault.
Actions without owners or dates
An action list without a named owner and a date is a wish list. The single most reliable predictor of whether a corrective action closes is whether the minutes record a person and a deadline.
Sharing Returns Data Without Losing Leverage
Share the defect, not the customer
The factory needs the defect, the lot, the measurement and the photograph. It does not need the end customer’s identity, the retail price or the margin. Separating the technical data from the commercial data allows a free exchange of evidence without exposing the buyer’s position.
Give the data a fixed format
A monthly file with the same columns, sent on the same day, becomes a routine the factory plans around. A series of ad hoc emails with screenshots is read once and then ignored, and the difference in response quality is substantial.
Ask for lot records in return
Data sharing should be reciprocal. In exchange for returns data, the factory provides the production record behind each affected lot: cutting date, material batch, line, inspector and inspection result. Two-way exchange is what turns the relationship from a complaint channel into a joint process.
Running the Loop With a Small Range
Use rates, not percentages
A buyer selling four thousand units a year cannot compute a meaningful percentage on a single style. A rate per thousand units sold, pooled across styles that share construction, produces a figure that is stable enough to act on.
Pool by construction, not by product name
Two styles with different names but the same handle anchor, the same edge process and the same lining attachment will fail in the same way. Grouping by construction gives a small programme enough volume to see a pattern.
Slow the cadence to match the volume
A weekly review on a range that generates three returns a week produces noise. A monthly review with a quarterly commercial checkpoint is the right rhythm, and it keeps the analysis honest because each period contains enough units to compare.
The First Ninety Days
Weeks one and two: taxonomy and capture
Adopt the twelve codes, build the drop-down list at the returns counter, and start photographing every return. Nothing else changes in the first two weeks, because accurate capture is the foundation for everything that follows.
Weeks three to six: lot labelling and backfill
Add the lot reference to the internal label and to the packing list, then backfill lot attribution for the returns already in the system using shipment dates. Attribution rarely reaches a hundred percent on historical data, but it improves quickly on new stock.
Weeks seven to twelve: one Pareto, one action, one verification
Build the first Pareto by cost, select the single largest code, and run one corrective action through containment, cause, correction and verification on the next lot. One completed cycle teaches the organisation more than a dashboard covering twelve codes with no closed actions.
What to measure in the first month
Only two numbers matter at the start: the share of returns that carry a defect code, and the share that carry a lot reference. Both should rise quickly towards one hundred percent. Defect rates become meaningful only once those two capture ratios are stable.
| Failure mode | Symptom in the data | Correction |
|---|---|---|
| Late reporting | Quarterly batches, no open lots | Monthly fixed file |
| Over-aggregation | One rate across all styles | Split by style and code |
| Uncoded returns | Large unknown category | Drop-down at the counter |
| No lot link | Low attribution rate | Lot code on inner label |
| Blame culture | Under-reporting by staff | Process focus, no operator penalties |
| Open-ended actions | Actions older than a quarter | Owner and date in the minutes |
| Unverified fixes | Same code returns next season | Pre-defined verification test |
Trending the Codes Over Time
A single month of coded returns is a snapshot. The value of the taxonomy appears in the third month, when each code has a history and the direction of travel becomes visible.
Twelve-month rolling rates
A twelve-month rolling rate for each code smooths seasonal peaks and shows whether a defect is genuinely reducing or simply out of season. Rolling rates also survive a change of personnel on either side, which a month-on-month comparison does not.
Flagging deterioration early
Two consecutive months above the rolling average for a single code is enough to open a query. The query does not need a full corrective action yet, only the lot list and one question to the factory, which costs a day rather than a month and often catches a material batch before it is fully consumed.
Retiring codes that disappear
A code that produces no returns across four quarters has been designed out or is no longer monitored properly. Either conclusion is useful: the first allows inspection to be reduced, the second reveals a data gap that would otherwise stay invisible until a customer complains.
FAQ
How should a bag factory receive returns data?
As a monthly file with fixed columns, one row per returned unit, carrying style code, lot reference, defect code, purchase date, return date and a photograph. The same format on the same date each month matters more than the sophistication of the analysis, because a predictable format is what the factory can plan resources around.
How many defect codes should a returns taxonomy have?
Around a dozen for PU leather bags. Too few codes merge distinct failures and the analysis loses its target; too many codes split the same failure across categories and no single code reaches a meaningful volume. Twelve codes covering seam, stitch, edge, hardware function, hardware finish, zipper, lining, handle, dimension, colour, odour and packaging is a practical starting point.
What return rate should a bag importer consider acceptable?
There is no universal figure, because the rate depends on price point, construction and channel. The useful benchmark is internal: the rate for the same construction across successive seasons, and the gap between the best-performing and worst-performing lots of the same style. A stable internal benchmark reveals deterioration long before an industry average does.
How do you link a returned bag to its production lot?
Through the carton reference on the packing list, or a small lot code printed on the internal label. The factory’s production record behind that lot identifies cutting date, material batch, production line, shift and inspection result, which is what makes a defect traceable to a cause rather than to a supplier in general.
Should returns be ranked by count or by cost?
By cost. A frequent packaging scuff costs a replacement bag, while a rare handle pull-out costs two freights, a replacement, an inspection and sometimes an account. Ranking by the full cost of poor quality regularly changes which defect deserves the first corrective action.
What is the difference between containment and a corrective action?
Containment protects the customer while the process change is still being implemented, usually through a hundred percent check on the specific characteristic across warehouse, transit and factory stock. A corrective action changes the process so the failure stops being produced. Containment without a corrective action simply becomes a permanent inspection cost.
How is a corrective action verified?
By defining the test before the fix is accepted: which check, on which characteristic, at what sample size, across how many lots. Verification then compares the same style and a comparable sales window. Because returns lag sales by two to three months, a fix judged in a low season will look better than it is.
How quickly should returns data reach the factory?
Within a month, and sooner for a cluster that can still be tied to material in stock. A quarterly report arrives after the batch is consumed and the operators have rotated, which makes the analysis correct but unusable, because the fix can no longer be traced to a lot or verified against it.
What if the factory rejects the defect classification?
Return the unit. A classification argument conducted over photographs produces opinions; the same argument conducted with the bag on the table produces measurements. Stitch density can be counted, film thickness measured and plating examined, and the discussion usually ends within an hour when the unit is present.
Do chargebacks improve quality?
They recover cost, and their larger value is attention. A chargeback itemising the defect code, the affected lots and the calculation is read by the factory owner; a lump-sum deduction is absorbed into the price of the next order and changes nothing. Pair every chargeback with a corrective action request or the money returns as a cost.
How many returned units should be kept as evidence?
Two or three per open defect code, labelled with lot, date and code, alongside a short record of the measurements and the conclusion. Retaining everything creates a room nobody enters; retaining nothing leaves a cause analysis resting on photographs. Dispose of units one review cycle after the action closes.
What is the most common reason the feedback loop fails?
Actions recorded without a named owner and a date. The second most common is data owned by the sales function, where returns are closed with a credit note and never reach the factory. Both failures are procedural rather than analytical, which is why they are cheap to fix once they are named.
Can a small brand with one factory run this process?
Yes, with two adjustments: use rates per thousand units rather than percentages, and pool styles by construction rather than by product name so that a shared handle anchor or edge process accumulates enough volume to reveal a pattern. Review monthly rather than weekly, and keep the quarterly commercial checkpoint.
What should be in the first ninety days?
Weeks one and two adopt the taxonomy and start photographing every return. Weeks three to six add lot labelling and backfill attribution for existing returns. Weeks seven to twelve build a Pareto by cost, run one corrective action all the way through verification on the next lot, and close it in writing with evidence attached.
Want returns data turned into process changes at the source?
Send your defect codes, affected styles and volume to info@gionar.com. We map each return code to the process that produces it — stitching, edge finishing, hardware plating or handle reinforcement — and implement the corrective action with lot-level records so the fix can be verified on your next production run.